How can I make the most of my predictive models for drug discovery?
What’s the purpose of a predictive model? What’s the value of predictive models for drug discovery? Most of the undergraduate…
What’s the purpose of a predictive model? What’s the value of predictive models for drug discovery? Most of the undergraduate…
Discover which metabolite prediction software is best for your needs in this comprehensive guide from Optibrium. Compare top tools like Meteor Nexus, MetaSite, and StarDrop to make informed decisions for drug metabolism prediction
We’re often asked, “What’s the difference between QSAR and imputation models?”, so I’m going to explain how the methods differ, their advantages and disadvantages, and when each approach is applicable.
How number of users affect drug discovery software costs The number of people who need access to the platform is…
To guide drug design, it’s important to understand the likely ADME and physicochemical properties of your compounds at an early…

Everyone knows smooth collaboration can speed up successful drug discovery projects. But how can we collaborate easily in drug discovery…

Successful drugs require a delicate balance of many properties, such as potency, ADME and toxicity, to meet a project’s therapeutic objective. To make decisions about compound progression and assay selection, the available data must be assessed against project-specific criteria. However, the data on which we base our decisions often come from different sources and can vary in quality, so how can we use this information to make confident decisions? In addition, how can we be sure that the criteria we’re using are the most appropriate?
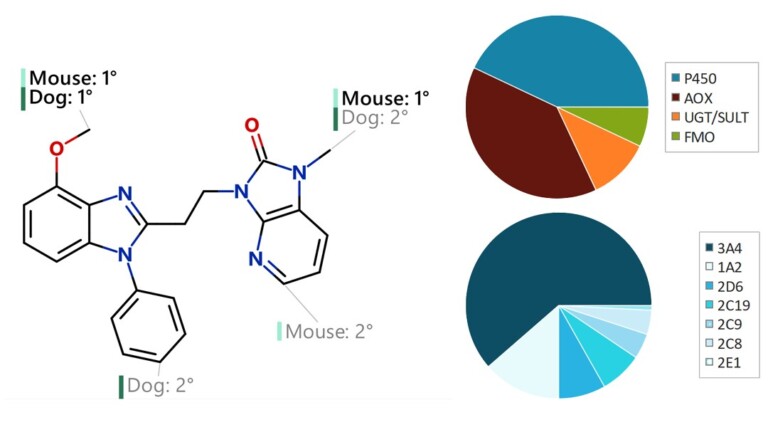
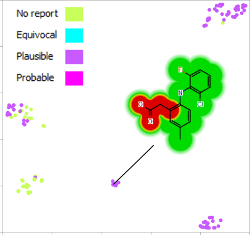
This peer-reviewed paper in Xenobiotica describes a new method to determine the most likely experimentally-observed routes of metabolism and metabolites based on our WhichP450™, regioselectivity and new WhichEnzyme™ model.
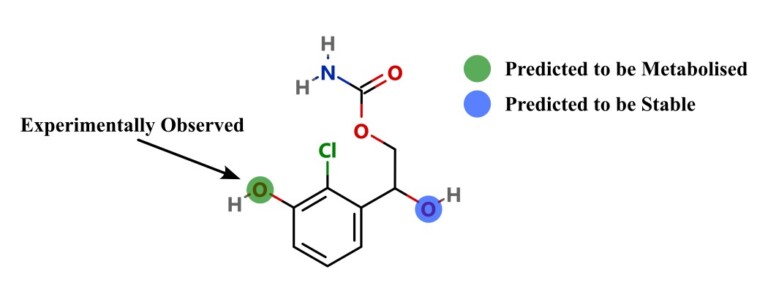
This paper describes a model to predict whether a particular site on a molecule will be metabolised by cytosolic sulfotransferase enzymes (SULTs).
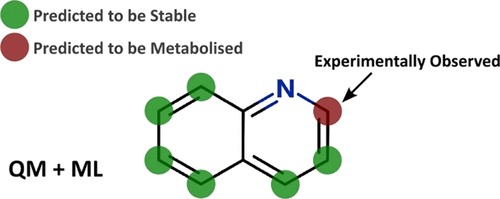
Watch Optibrium CEO Matt Segall and Principal Scientist Mario Öeren as they explore groundbreaking new quantum mechanics and machine learning models which go beyond P450s and provide insights on a broad range of enzymes involved in drug metabolism.
This paper describes the prediction of the regioselectivity of metabolism by AOs, FMOs and UGTs for humans and CYPs for three preclinical species.
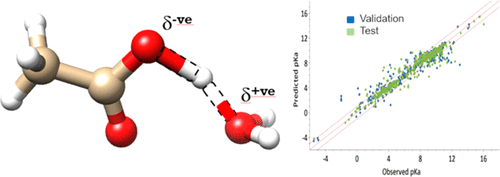
This study aimed to create a model for predicting pKa using a semi-empirical quantum mechanics (QM) approach combined with machine learning (ML).
This article explores the benefits of a more intuitive and flexible approach to viewing and interacting with drug discovery data,…
Summary In this article, ‘Addressing toxicity risk when designing and selecting compounds in early drug discovery‘, we discuss the application…
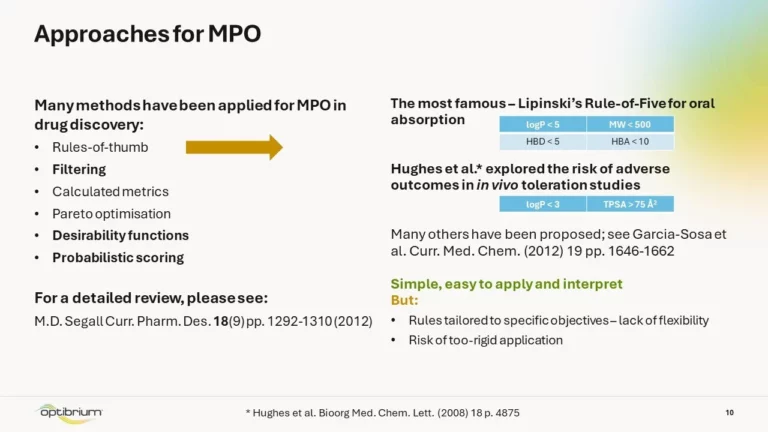
Summary There are many different definitions of ‘drug-like’, with rules proposed based on property trends seen in successful drugs. In…

Summary This article explores the psychological barriers and risks of cognitive biases to R&D decision-making. It contrasts current practice with…
Summary In this study, the researchers look to solve classification quantitative structure−activity relationship (QSAR) modelling problems using Gaussian processes. They…
Summary In this study, our researchers combined an automatic model generation process for building QSAR models with the Gaussian Processes…