Matched series analysis
The objective in this worked example is to identify new derivatives that are likely to improve activity at their target, given the SAR already generated on a project.
The objective in this worked example is to identify new derivatives that are likely to improve activity at their target, given the SAR already generated on a project.
Explore ways to use the Inspyra Panel, in combination with Matched Series Analysis (MSA).
This worked example uses Inspyra™ to interactively explore optimisation strategies to achieve a selective inhibitor of DPP-4 with appropriate physicochemical properties.

In this example, we are going to use the reaction-based library enumeration feature in StarDrop’s Nova module to generate a library of virtual compounds. This will be based on pre-defined sets of reagents that will be used to generate products using well-known reactions.
This worked example uses StarDrop’s Surflex eSim3D module to assess a small library of compounds for their similarity to known Heat Shock Protein 90 (HSP90) ligands.

During this example we will consider three compounds from a lead series which we would like to try to evolve into a candidate. The compound has a good profile of ADME properties but insufficient inhibition of the target, the Serotonin transporter. In this example we will use StarDrop’s Nova module to generate new ideas for compounds to improve the potency while maintaining the balance of other properties.
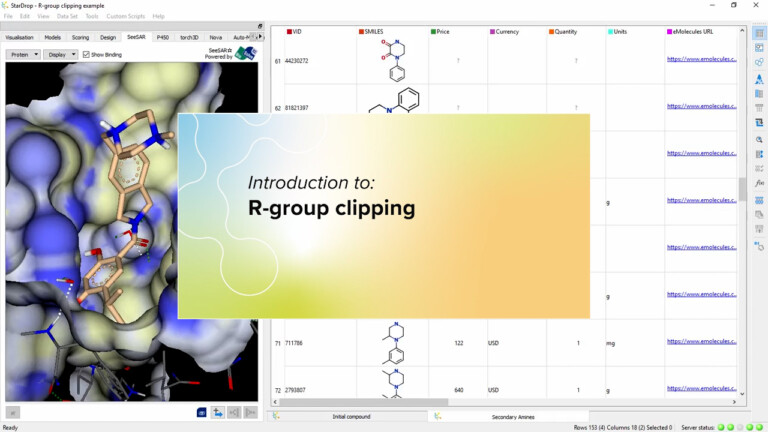
In this example, using StarDrop’s R-group clipping tool, we will quickly transform chemical building blocks into their corresponding substituents, ready to enumerate a virtual library in StarDrop’s Nova module.
This worked example explores ways to assess and design compounds in 3D using the SeeSAR Pose module.
This worked example explores ways to assess the binding affinity of docked compounds.

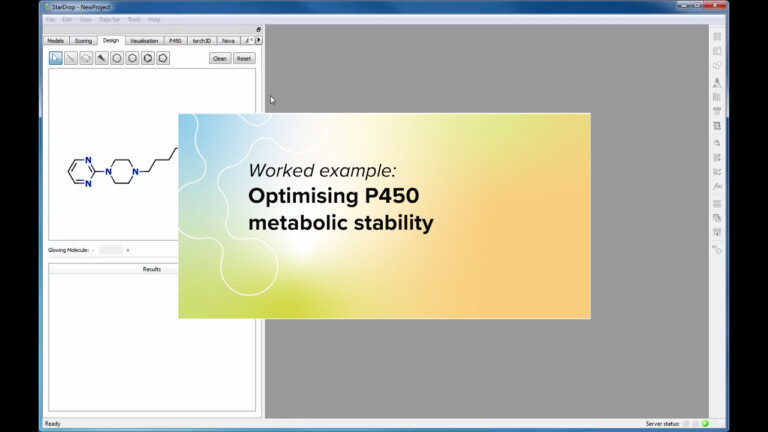
In this example we will explore the feasibility of pursuing a fast-follower for Buspirone, a 5-HT1A ligand used as an anti-anxiolytic therapeutic, which has a known liability due to rapid metabolism by CYP3A4.
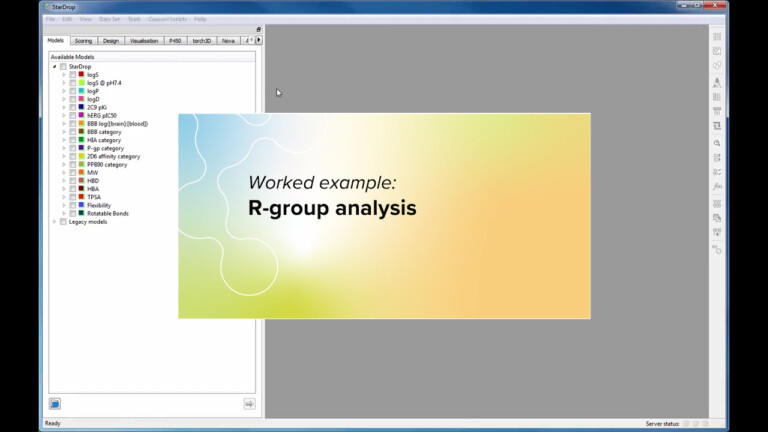
This example looks at R-group analysis of chemical series to identify key functionalities which influence potency.
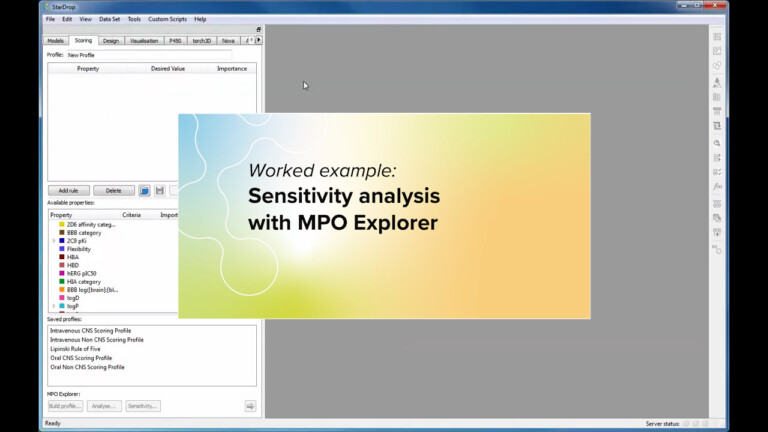
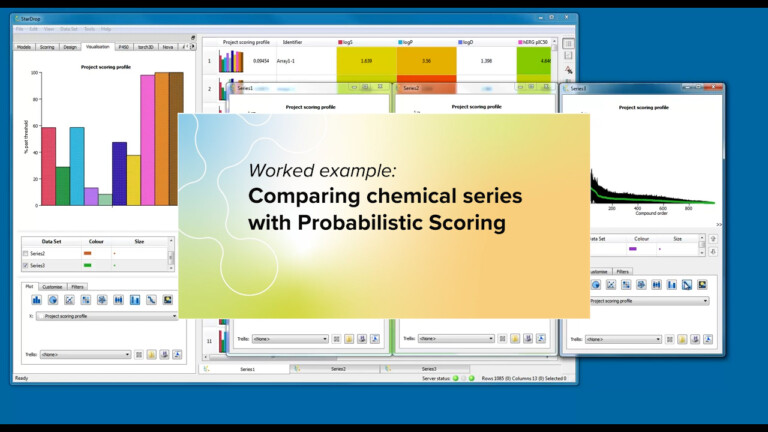
In this example, we will use the Sensitivity Analysis tool in StarDrop’s MPO Explorer module to check if the ranking of compounds in a data set is sensitive to any of the criteria or importance values in a scoring profile.
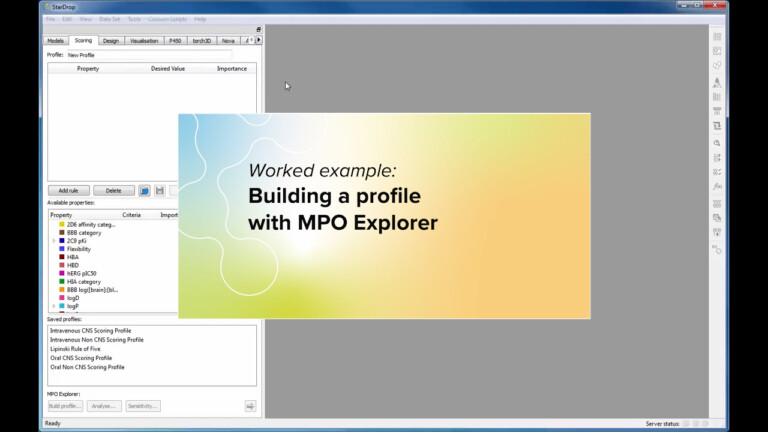
In this example we will use the Profile Builder in StarDrop’s MPO Explorer module to derive a multi-parameter scoring profile, based on a CNS data set.
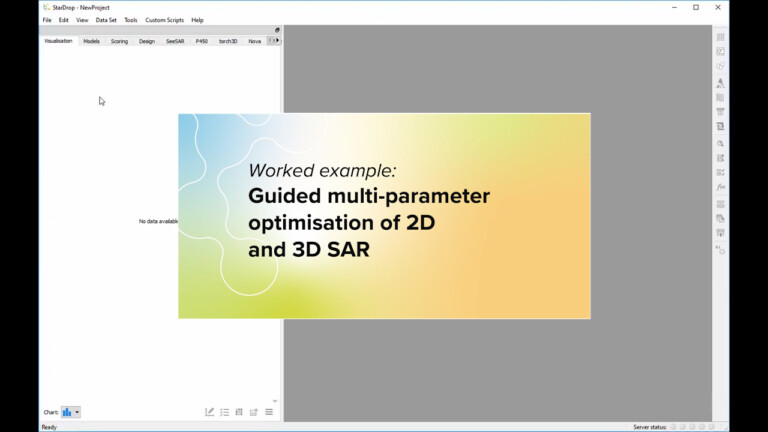
This SeeSAR and ADME QSAR worked example uses a combination of 2D and 3D methods to understand and optimise a virtual library of Heat Shock Protein 90 (HSP90) inhibitors.
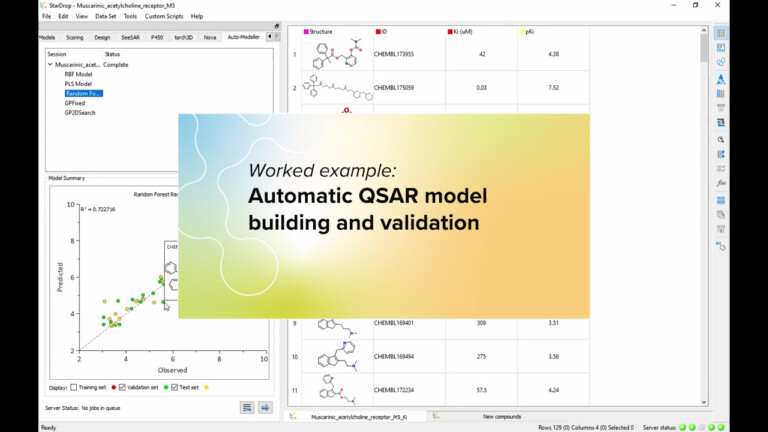
This example explores the application of the Auto-Modeller module to build a QSAR model of potency against the Muscurinic Acetylcholine M5 receptor, based on public domain Ki data. The resulting model is applied to novel compound to predict their properties and visualise the SAR.
This example is taken from a project in which screening of a diverse library resulted in hits from multiple chemistries.…
In this example, scaffold hopping with library enumeration, we are going to use the library enumeration feature in StarDrop’s Nova…
Try Matched Series Analysis in this follow-along tutorial
In this example, Card View is applied to analyse the results from a kinase project in which a large screening…
