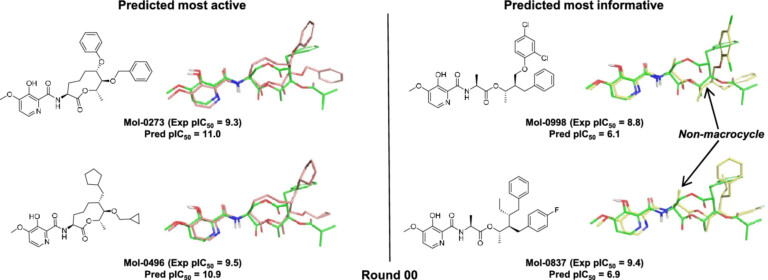
From UK-2A to florylpicoxamid: active learning to identify a mimic of a macrocyclic natural product
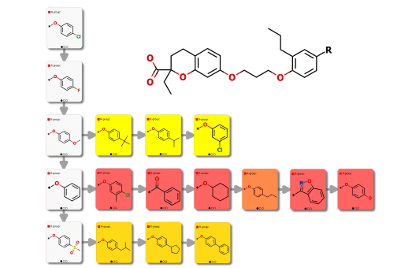
Scaffold replacement as part of an optimisation process that requires maintenance of potency, desirable biodistribution, metabolic stability, and considerations of synthesis at very large scale is a complex challenge.