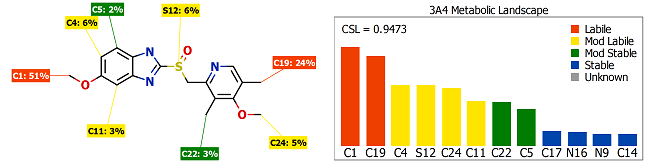
Predicting regioselectivity and lability of P450 metabolism
This article describes the underlying methods, validation and example applications of the most recent models of Cytochrome P450 metabolism in…
This article describes the underlying methods, validation and example applications of the most recent models of Cytochrome P450 metabolism in…
In this webinar we discussed how you can ensure that you don’t miss valuable opportunities due to the criteria used…
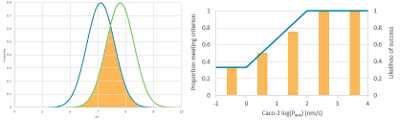
This peer-reviewed paper discusses the challenges of using uncertain experimental data to make confident decisions on the selection of compounds.…
This article explores the benefits of a more intuitive and flexible approach to viewing and interacting with drug discovery data,…
Summary This review article discusses recent developments in the methods and opinions around multi-parameter optimisation, focusing on applications to de novo drug…
Summary In this drug optimisation article, co-authored with Pfizer we discuss new ‘rule induction’ methods. These explore complex data to…
Summary In this article, ‘Addressing toxicity risk when designing and selecting compounds in early drug discovery‘, we discuss the application…
Summary There are many different definitions of ‘drug-like’, with rules proposed based on property trends seen in successful drugs. In…

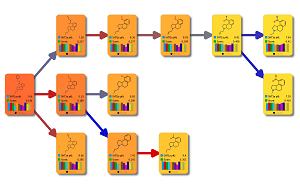
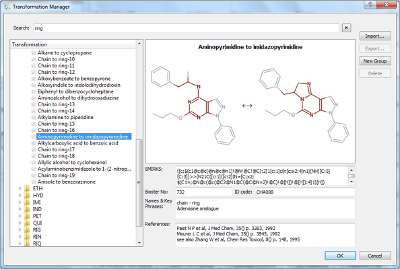
Summary This article on applying med chem transformations and multi-parameter optimisation describes the concepts and algorithms underlying StarDrop’s Nova module. We’ve developed…
In this multi-parameter optimisation review, we survey the range of methods used for MPO in drug discovery, compare their strengths…
Summary This article explores the psychological barriers and risks of cognitive biases to R&D decision-making. It contrasts current practice with…
Summary In this study, the researchers look to solve classification quantitative structure−activity relationship (QSAR) modelling problems using Gaussian processes. They…
Summary This article discusses Quantitative Structure – Activity relationships (QSAR) methods to predict absorption, distribution, metabolism, excretion and toxicity (ADMET)…
Summary In this study, our researchers combined an automatic model generation process for building QSAR models with the Gaussian Processes…
In this article, Olga describes how we extend the application of Gaussian Processes technique to classification problems. These computational techniques…
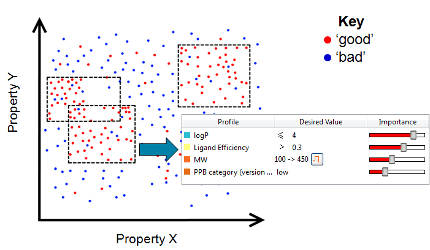
Summary The main use of ADMET models, whether in silico or in vitro,tends to be molecule ‘profiling’; identifying compounds which are expected to…
These two models calculates the number of sp3 carbons and the total number of carbons compound. These are available to…
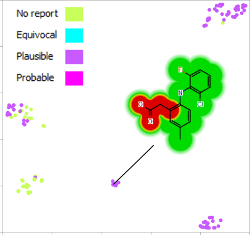
This short video gives an introduction to the Activity Landscape analysis tool in StarDrop and how you can view and…
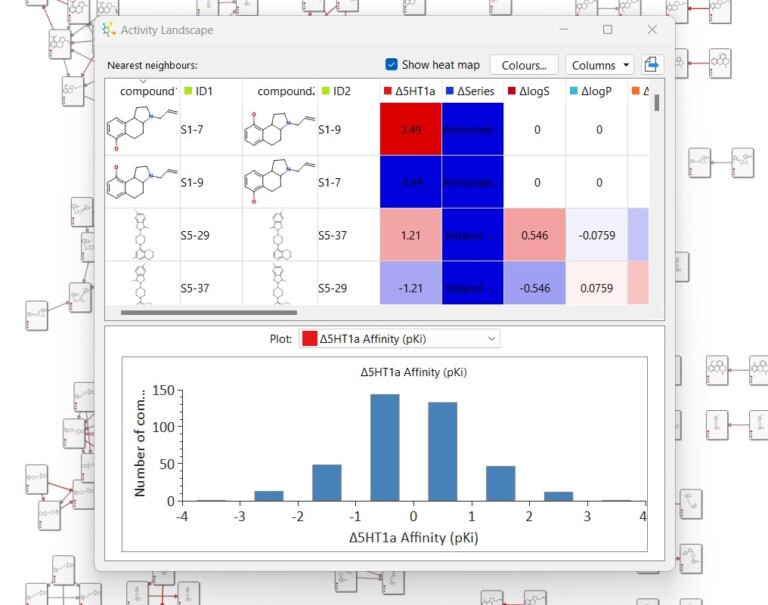
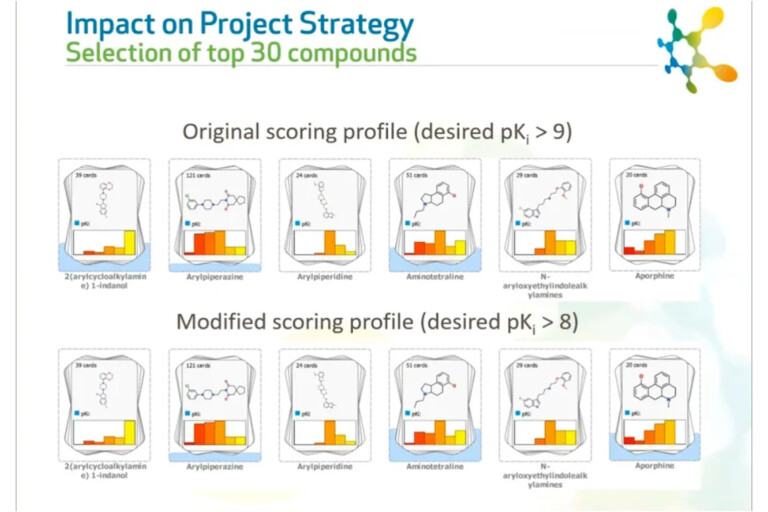
This example is taken from a project in which screening of a diverse library resulted in hits from multiple chemistries.…