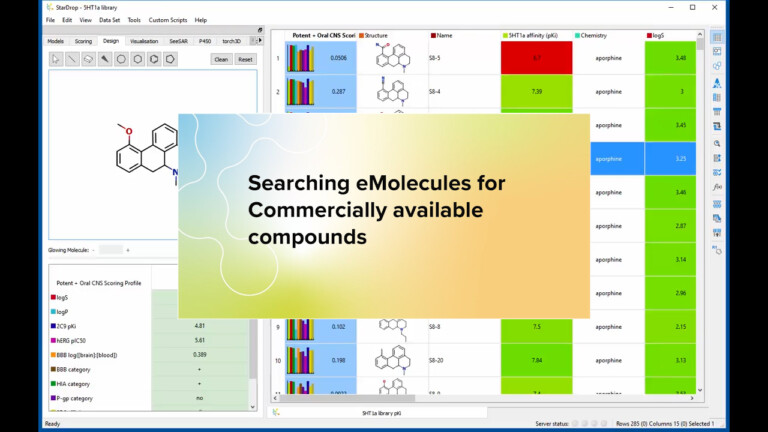
eMolecules plug-in for StarDrop
Version This script is for the latest version of StarDrop for either Windows or Mac. To find out which version you have…
Version This script is for the latest version of StarDrop for either Windows or Mac. To find out which version you have…
This script provides a method for calculating Ligand Efficiency in StarDrop; a simple quantifiable metric for assessing whether a ligand derives…

The x- and y-axis are not labelled because the visual clustering method being used is a nonlinear reduction algorithm attempting…
For the pKa models, the arrow is greyed out until you select some rows in your dataset. The pKa calculations…
Every model prediction is associated with an estimate of its confidence. You can see these by clicking on the ‘show…
In StarDrop, you can choose to cluster your data based on common substructure, chemical structure or property values. Structure and…
All of the models in StarDrop’s ADME QSAR module are rigorously validated using external, independent test sets. You can find…
LogS is log uM, so a logS of 1 corresponds to a solubility of 10 uM.
Everything that an user has been working on within StarDrop at any one time is part of a single project.…
You can easily define scoring profiles to define the properties and criteria that you require for a high-quality compound for…
The scoring profiles were developed in collaboration with expert DMPK scientists. It is based on their experience of successful drug…
Auto-Modeller doesn’t currently detect outliers when building models, it is dependent on a user’s own judgement. The Gaussian Processes methods…
For example, I realised after the fact that the data contains a continuous value (1.23, 34.35, etc) but also “>100”.…
We have published several papers using the methods in the Auto-Modeller. They are: In most cases, our users apply the…
A list and description of the descriptors used by the Auto-Modeller is available in Appendix 17.2 of the StarDrop Reference…
To calculate descriptors on the current data set, click the Calculate descriptors on the current dataset button within the Auto-Modeller…
The preclinical species models covered in the Metabolism module are rat, mouse and dog. These preclinical species were covered due…
Quantitative prediction of metabolic rate for diverse chemistry is currently intractable based on structure alone. Local models of metabolic rate…
Each prediction takes the form of a structural alert, identifying the structural feature which gives rise to the predicted risk…