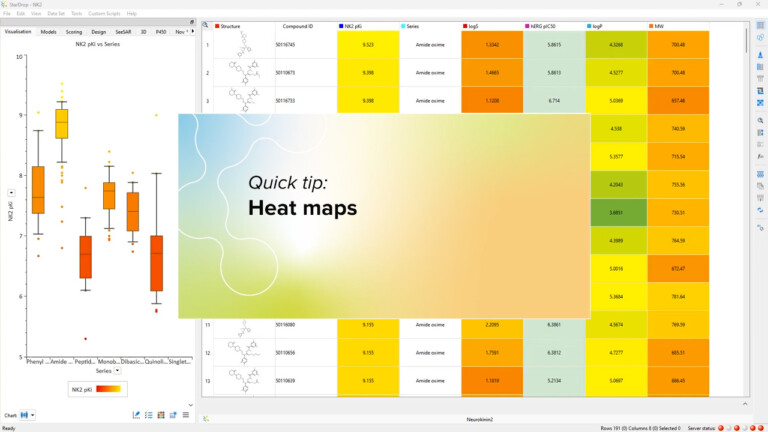
Heat maps in StarDrop
In StarDrop you can display heat maps for the properties contributing to an MPO score. We’ve extended this capability by…
In StarDrop you can display heat maps for the properties contributing to an MPO score. We’ve extended this capability by…
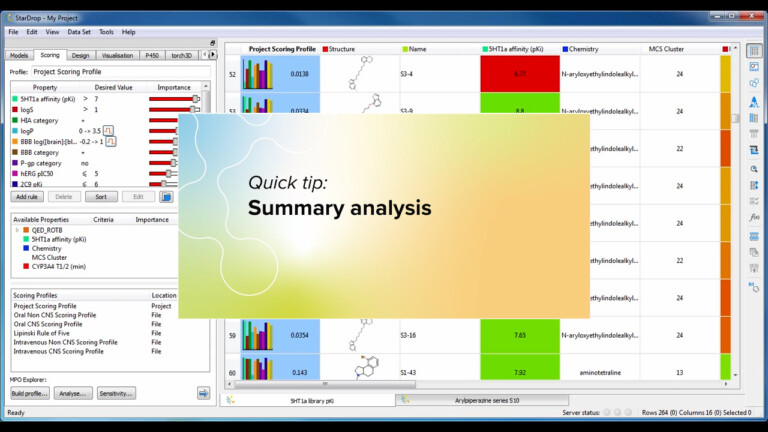
StarDrop’s summary analysis tool enables you to quickly see trends across the properties in your data sets. Take a look…
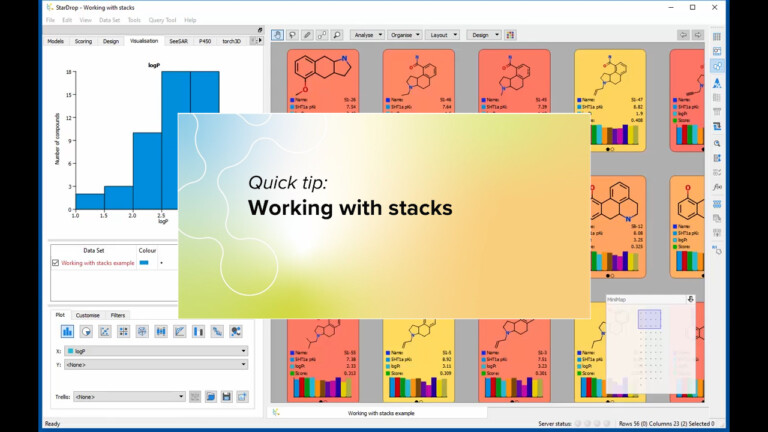
This short video gives an introduction to working with stacks in StarDrop’s Card View.
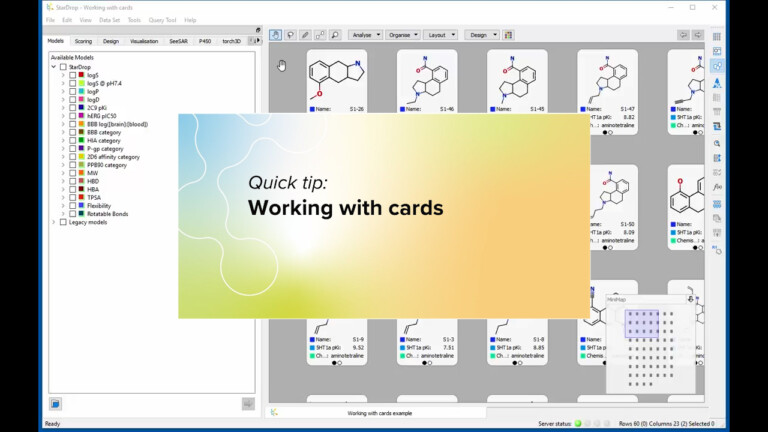
This short video gives an introduction to working with cards in StarDrop’s Card View.
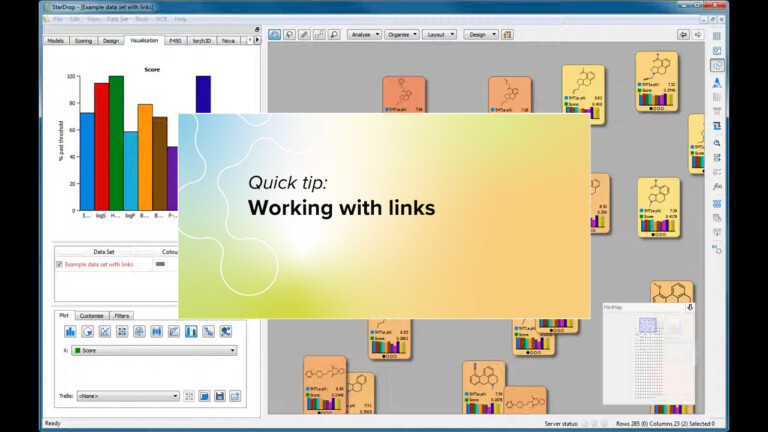
This short video gives an introduction to working with links in StarDrop’s Card View.
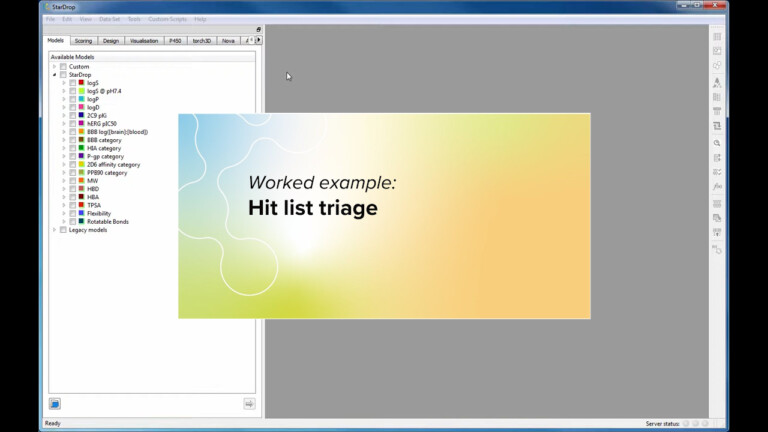
In this example, Card View is applied to analyse the results from a kinase project in which a large screening…
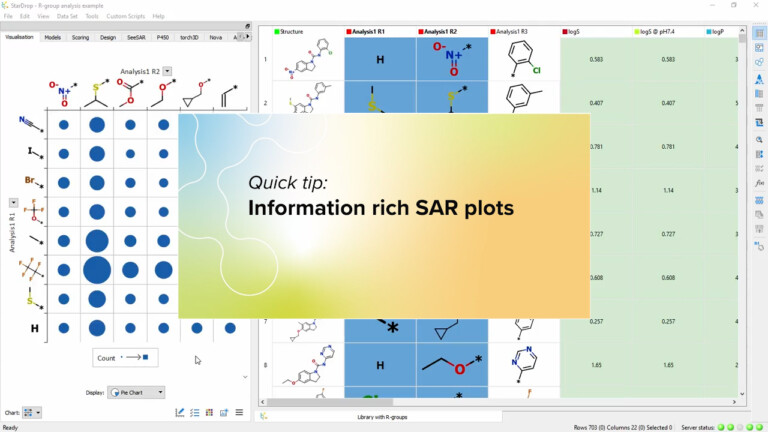
This short video illustrates how to create information rich SAR plots, including pie charts, histograms, scatter plots, radar plots, etc.…
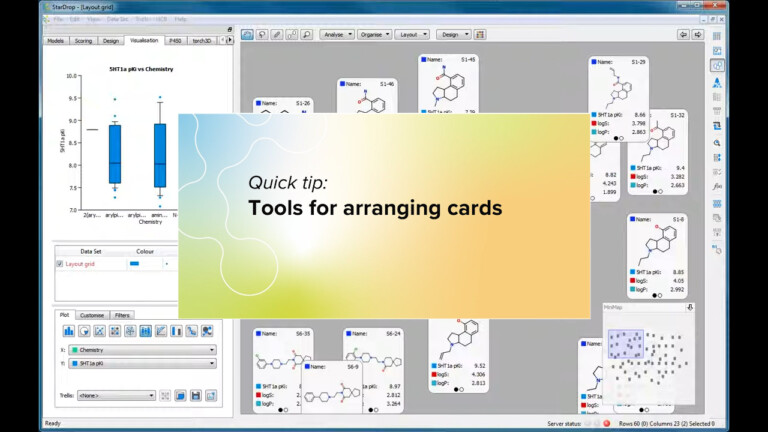
This short video gives an introduction to the tools provided by StarDrop’s Card View that help you to arrange cards…
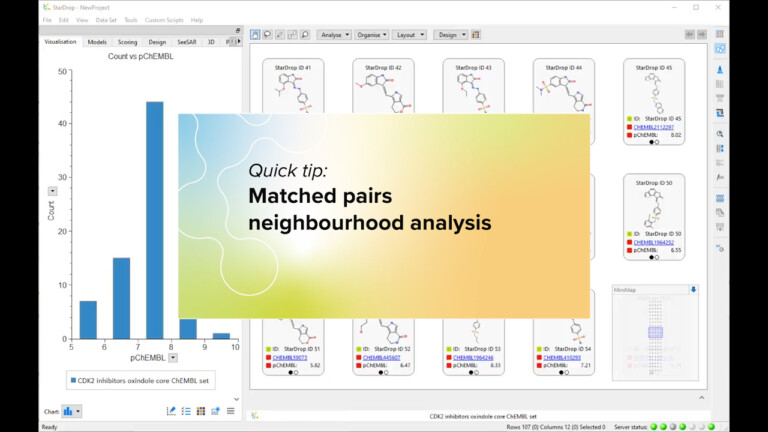
This short video gives an introduction to the Matched Pairs Neighbourhood tool in StarDrop’s Card View. If you are interested…
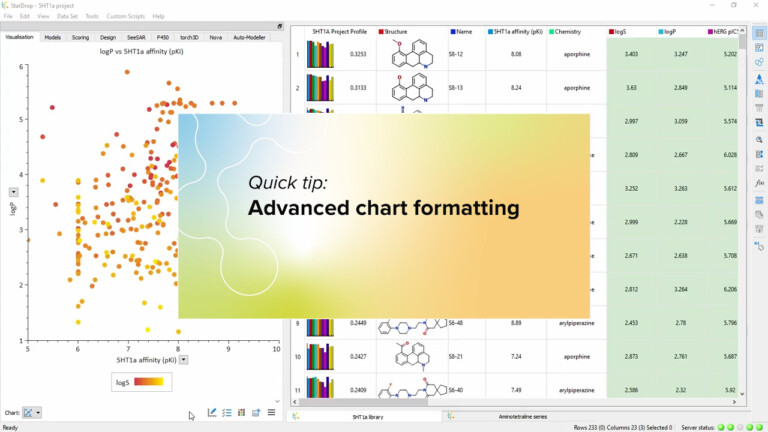
Here we’ll show how to tailor the format scales in your charts to highlight the property ranges in which you’re…
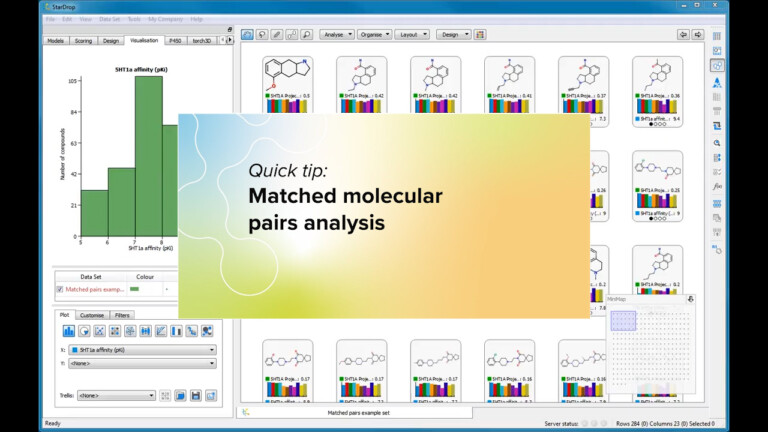
This short video gives an introduction to the Matched Molecular Pair Analysis tool in StarDrop and how you can interact…
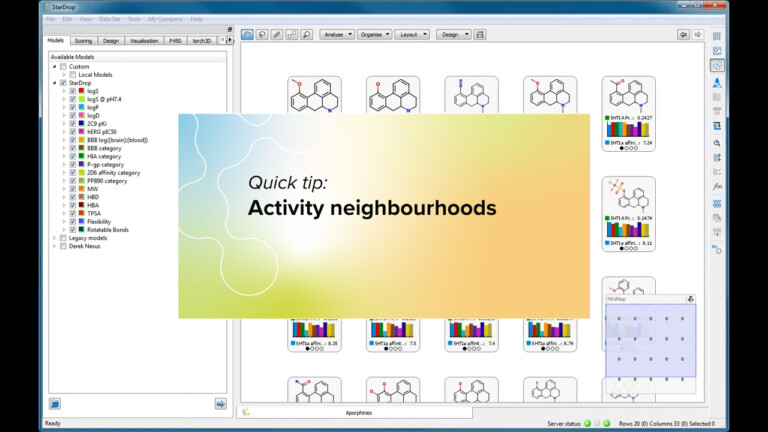
This short video gives an introduction to the Activity Neighbourhood analysis tool in StarDrop’s Card View.
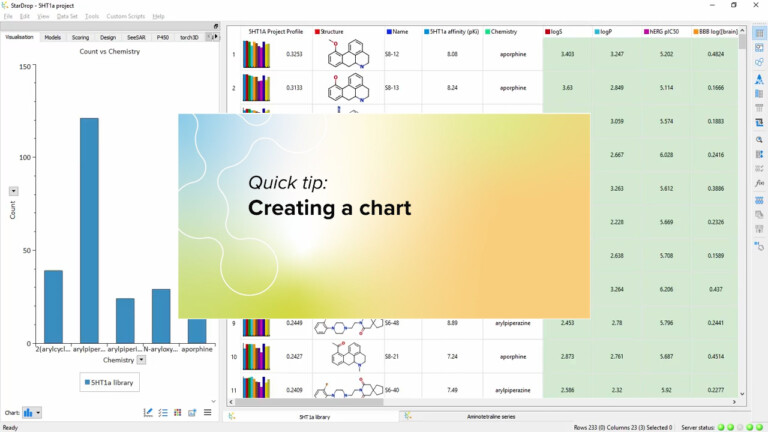
This short video introduces how to use the data visualisation in StarDrop to quickly create a chart in StarDrop from your data.
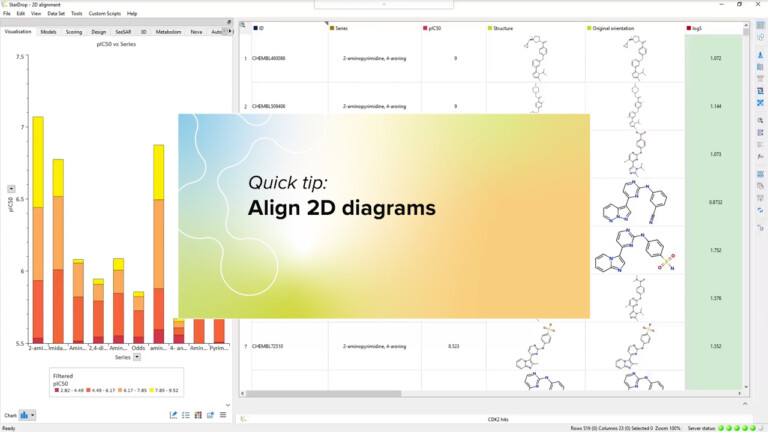
Using the 2D structure alignment tool in StarDrop, define a substructure to perform a rigid alignment of molecules in the data set.
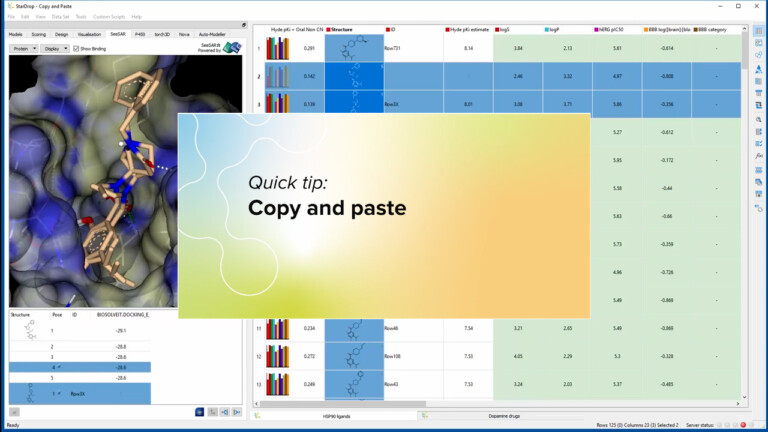
This short video illustrates how to you can simply copy selected compound identifiers, structures and any data directly from StarDrop…
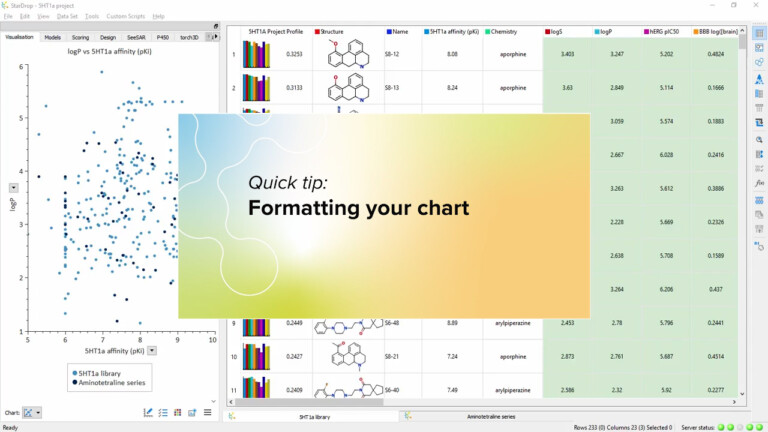
This video demonstrates how to format your charts, using the properties in your data set, by colour, size, symbol, transparency.
In this quick video, we show the many ways you can interact with your chart to show exactly the data…
