Heat maps in StarDrop
In StarDrop you can display heat maps for the properties contributing to an MPO score. We’ve extended this capability by…
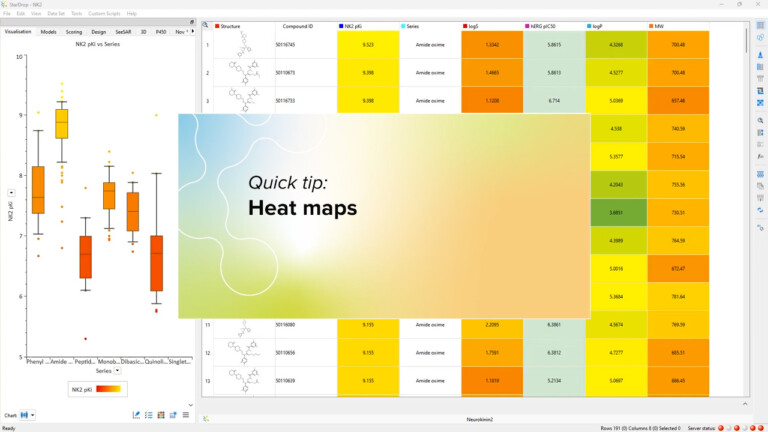
In StarDrop you can display heat maps for the properties contributing to an MPO score. We’ve extended this capability by…
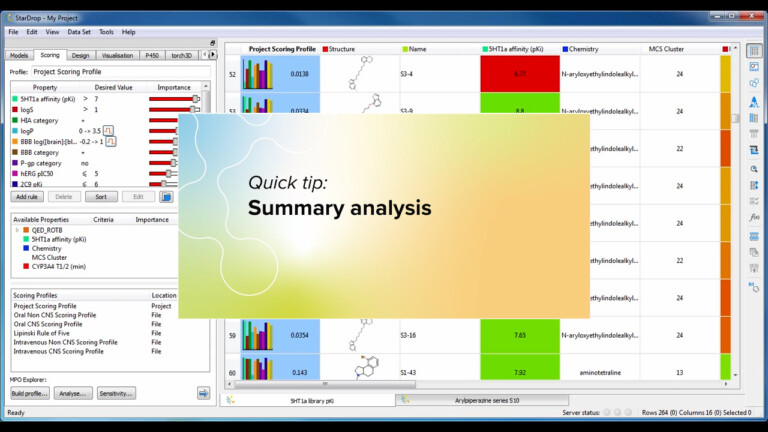
StarDrop’s summary analysis tool enables you to quickly see trends across the properties in your data sets. Take a look…
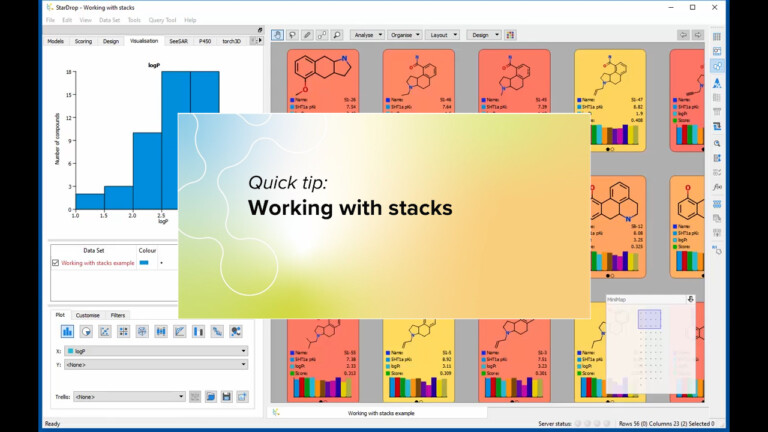
This short video gives an introduction to working with stacks in StarDrop’s Card View.
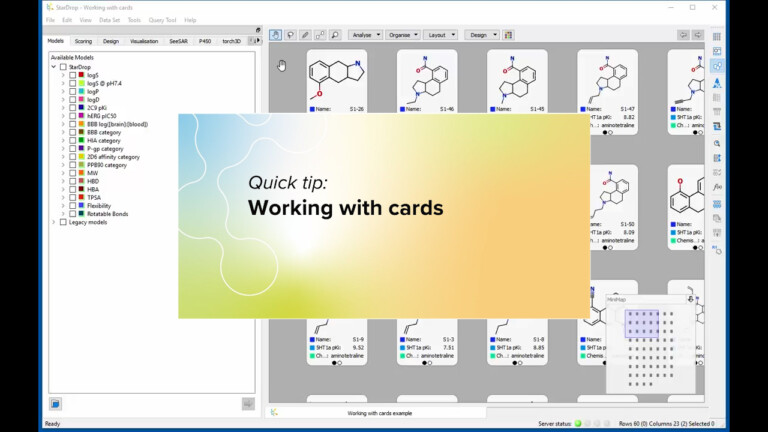
This short video gives an introduction to working with cards in StarDrop’s Card View.
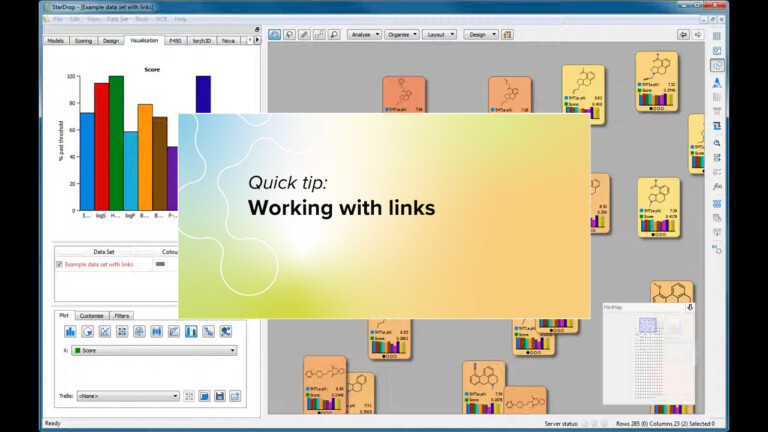
This short video gives an introduction to working with links in StarDrop’s Card View.
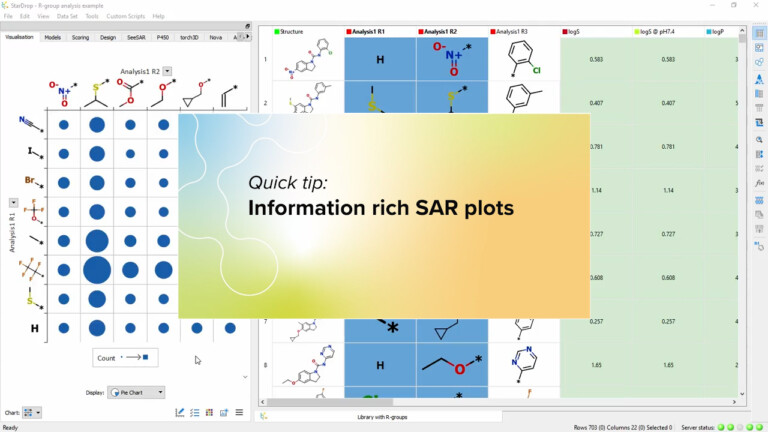
This short video illustrates how to create information rich SAR plots, including pie charts, histograms, scatter plots, radar plots, etc.…
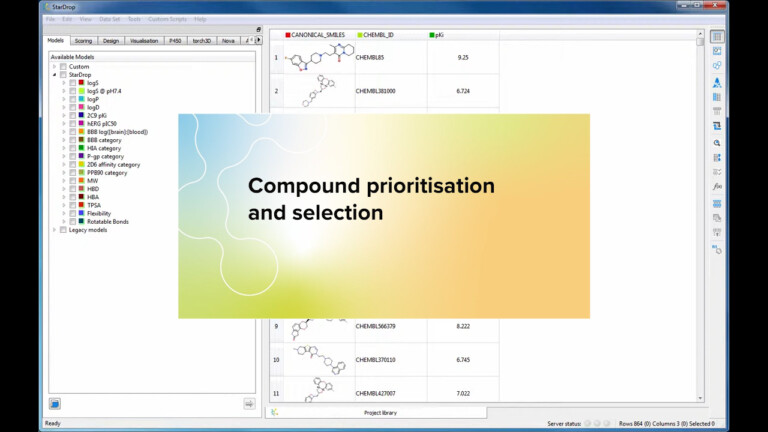
In this demo we’re going to take a look at how StarDrop can guide the prioritisation and selections of compounds using a combination of in vitro and in silico data.
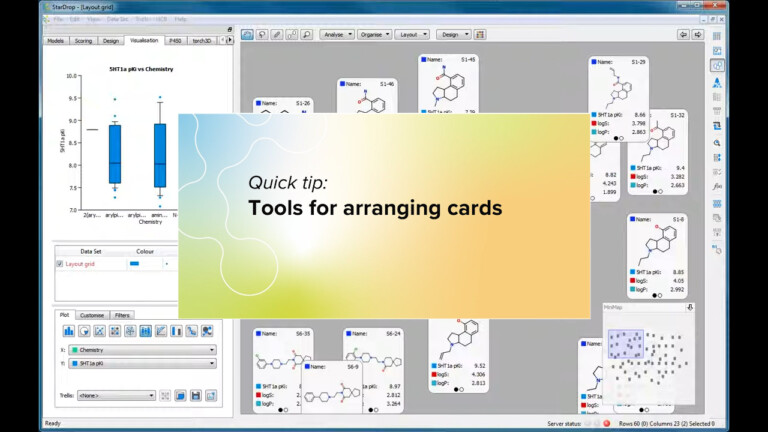
This short video gives an introduction to the tools provided by StarDrop’s Card View that help you to arrange cards…
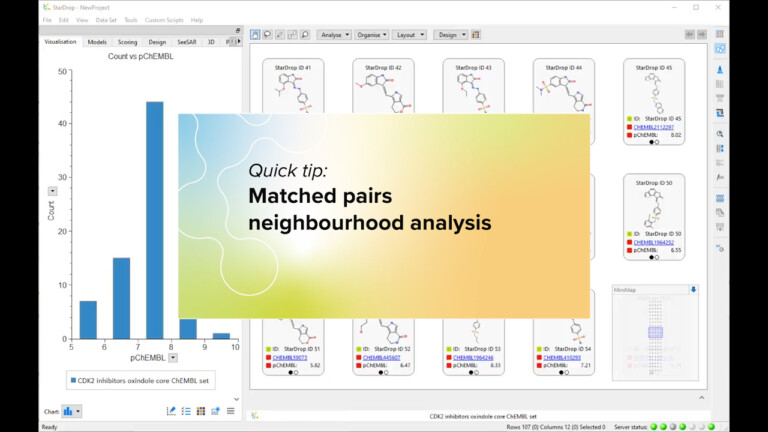
This short video gives an introduction to the Matched Pairs Neighbourhood tool in StarDrop’s Card View. If you are interested…
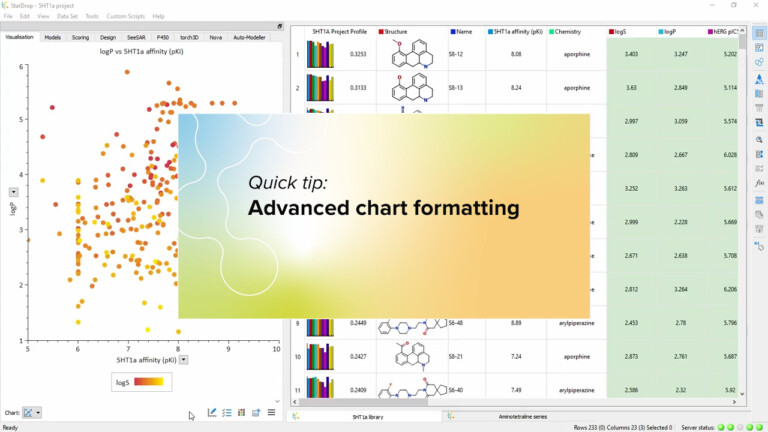
Here we’ll show how to tailor the format scales in your charts to highlight the property ranges in which you’re…
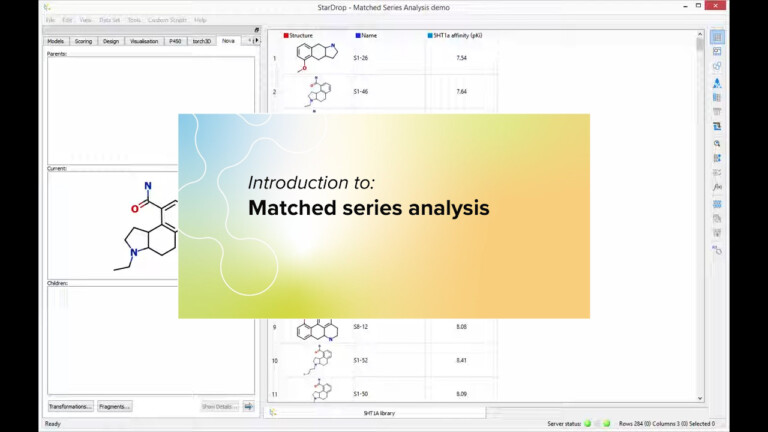
This short movie gives an introduction to StarDrop’s Matched Series Analysis which is part of the Nova module which searches databases of…
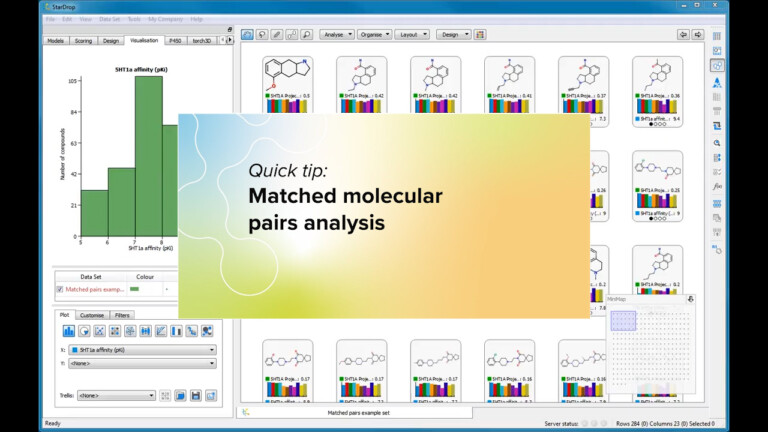
This short video gives an introduction to the Matched Molecular Pair Analysis tool in StarDrop and how you can interact…
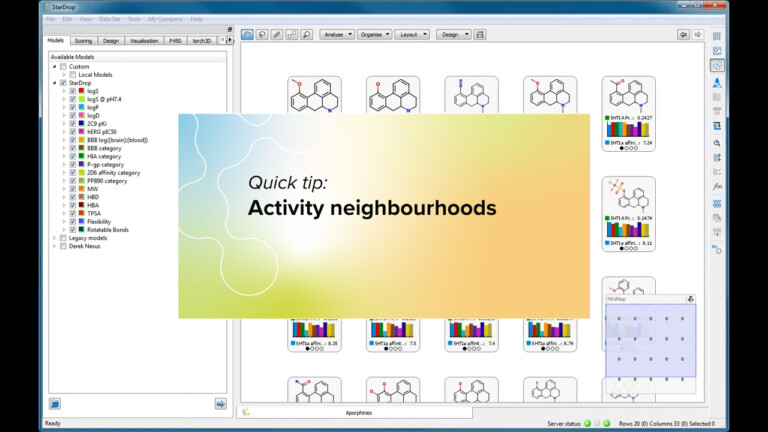
This short video gives an introduction to the Activity Neighbourhood analysis tool in StarDrop’s Card View.
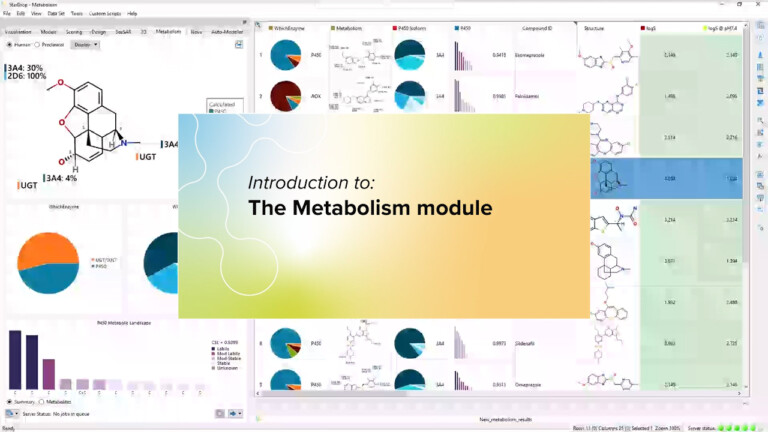
The Metabolism module enables you to accurately predict the major metabolic routes, sites, products and lability of Phase I and…
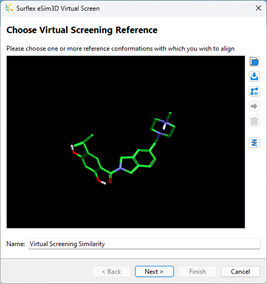
When exploring chemistry space around a known hit or lead, you can use 3D virtual screening to identify new compounds…
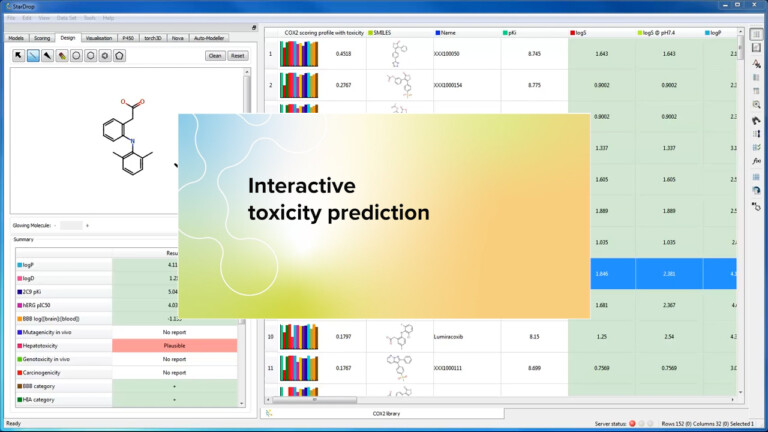
In this demo we look at how it’s possible to use the Derek Nexus module with StarDrop to guide the design of…
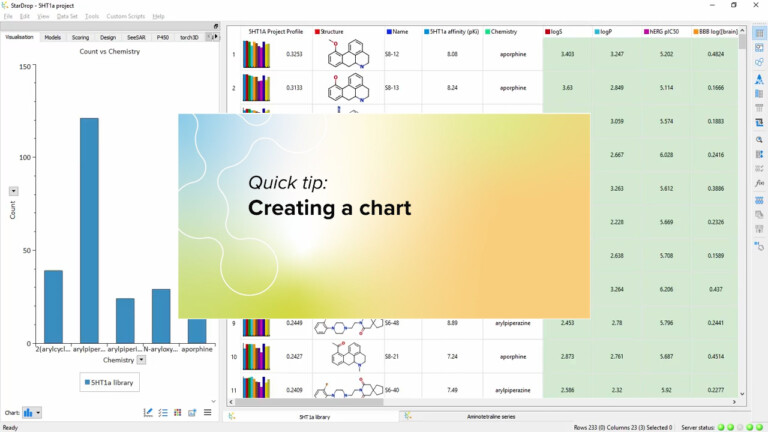
This short video introduces how to use the data visualisation in StarDrop to quickly create a chart in StarDrop from your data.
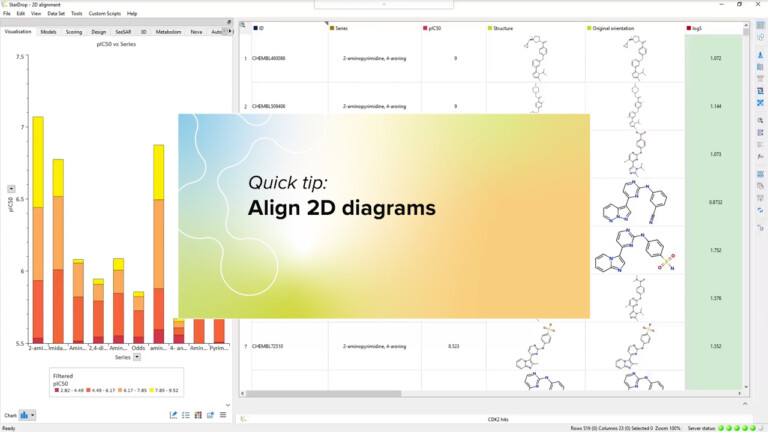
Using the 2D structure alignment tool in StarDrop, define a substructure to perform a rigid alignment of molecules in the data set.
This short video provides an orientation for StarDrop and Semeta users at organisations that are subscribing to Optibrium’s hosted services.…