Guiding selection and design in hit-to-lead
The objective in this example is to identify one or more high quality chemistries for progression to detailed in vitro…
The objective in this example is to identify one or more high quality chemistries for progression to detailed in vitro…
StarDrop users who have licensed the Surflex eSim3D module can freely download prepared virtual screening collections for use in StarDrop. MolPort’s commercially available screening…

Baell and Holloway published a set of substructure filters for removal of what they termed “Pan Assay Interference Compounds (PAINS)” from…

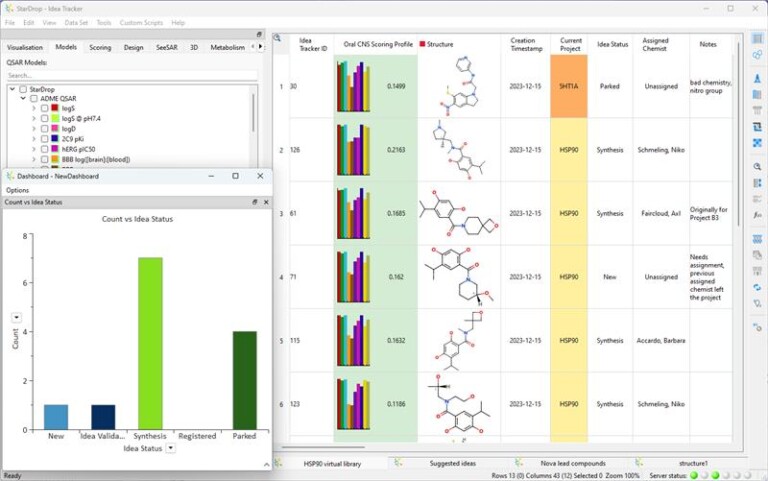
The new Idea Tracker capability further improves the efficiency of drug discovery by supporting project management, idea sharing and molecule design tracking
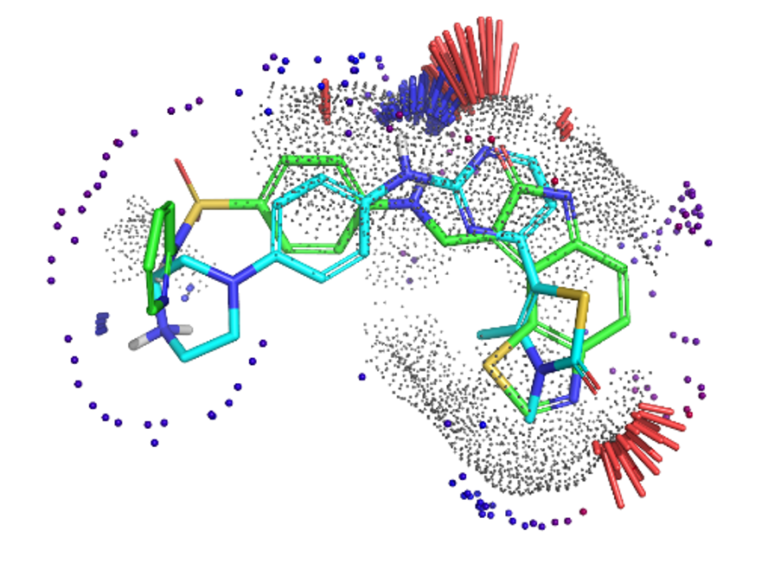
Innovative predictive methods support virtual screening and compound design in the absence of 3D structure data.
This example code shows how to write a custom model using Python. This example can be used to make in-house…

This can occur due to plugging into a docking station or installing a virtual network adaptor such as a VPN.…
The floating license is controlled by a license server. Whilst it can be installed on multiple computers, only one user…
A Fixed license is installed on a specific machine using the machine’s ID and governs which modules can be accessed…
Yes, it is possible to align molecules in StarDrop. To do this, select Align 2D Diagrams from the Data Set…
A Glowing Molecule represents the model result indicating the parts of the molecule that have the greatest influence on the…
StarDrop and Semeta can read SD (.sdf), comma separated value (.csv), SMILES (.smi), text (.txt), mol (.mol) and mol2 (.mol2)…
There is no hard limit to the number of compounds that can be loaded and analysed in StarDrop since it…
See worked example for the Nova library enumeration, the example will outline steps for generating a library of virtual compounds.…
This is a worked example that uses the reaction-based library enumeration feature in StarDrop’s Nova module to generate a library…
The models are retrained on an ad hoc basis. The models we provide are intended to cover as much of…
It is possible to add custom models scripted in Python to StarDrop using the StarDrop model server. From the StarDrop…
Compounds with missing or unknown data will receive a representative score based on the rest of the data set with…
StarDrop users who have licensed the Surflex eSim3D module can freely download prepared virtual screening collections for use in StarDrop. Enamine’s commercially available screening…