
How does StarDrop support
your hit-to-candidate process?
Visual data insights
Chemists love StarDrop’s intuitive visualisation capabilities that surface actionable insights from complex drug discovery data. Our flexible interface lets you organise and explore data your way, uncovering hidden patterns and SAR trends that drive projects forward whilst making it easy to share findings with colleagues.
Clustering in Card View
With Card View® you can organise and annotate compounds and data in a way that mirrors your thought process to speed up decision making.
Cluster groups of ‘similar’ compounds together to identify chemical series within a data set of diverse compounds, analyse SAR around hits for triaging results from high throughput screening or to identify ‘regions’ of chemistry that may yield favourable properties or scores.
StarDrop provides three different approaches to defining clusters. These include maximum common substructure, compound similarity and properties.
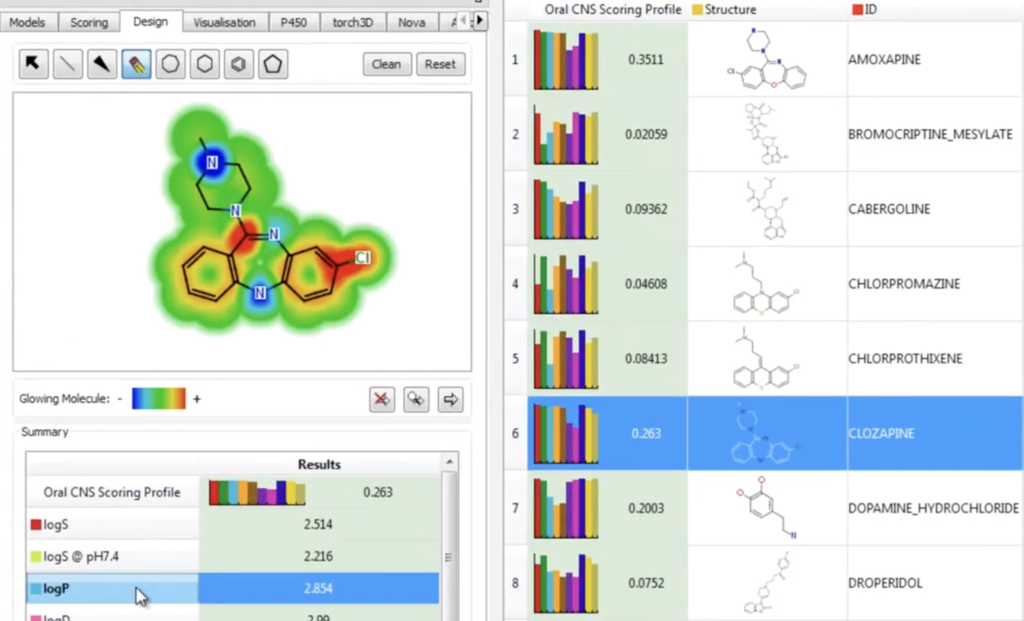
Glowing Molecule
StarDrop’s Designer guides the re-design of your compounds and enables you to interactively explore the impact of structural changes on your compound’s predicted properties. The Glowing Molecule™ links the structure-activity relationships captured by advanced, non-linear modelling techniques with the structure of your compound, so that you can easily visualise the regions of your compound having the greatest impact on a property. This aids your interpretation of predictive models to guide the design of improved compounds.
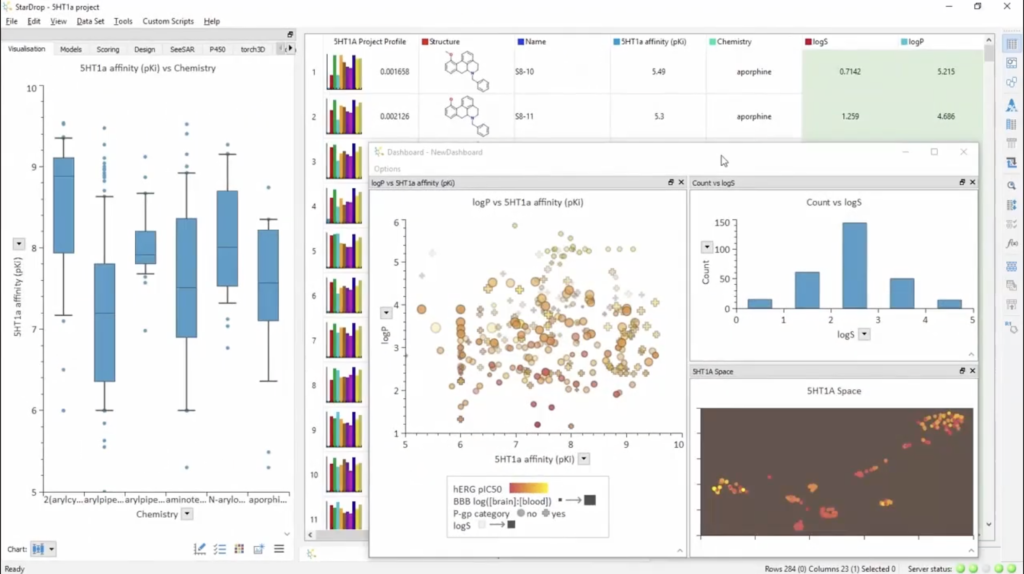
Charts and dashboards
StarDrop’s drug discovery data visualisation provides a wide variety of chart types, including: histograms, box plots, SAR and category plots, 2D and 3D scatter plots, radar plots, heat maps, pie charts, line and multi-line plots, and ROC curves.
You can include multiple data sets and series in the same chart, represent additional properties by colour, point, size and symbol, border or transparency, and trellis charts to highlight relationships between compounds, properties and data sets.
With StarDrop you can instantly zoom, pan and rotate your charts to spot important relationships. Explore your data further by interactively selecting interesting compounds or filter the data in your charts by multiple properties. Compounds of interest can be annotated and labelled and you can also customise your charts with different fonts, ready for inclusion in your reports and publications by simple copy and paste.
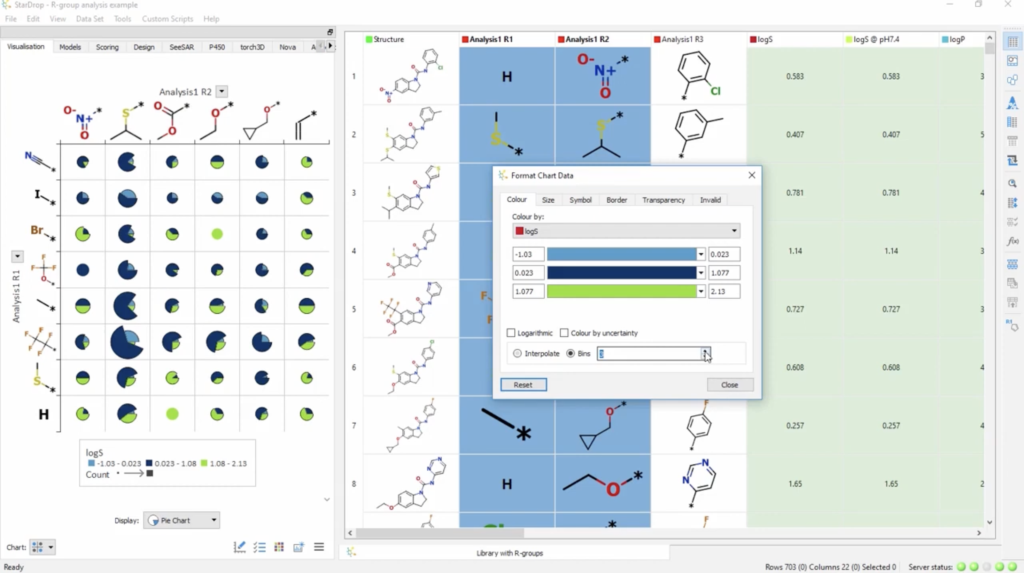
Information-rich SAR plots
With StarDrop you can create information-rich structure-activity relationship (SAR) plots, enabling you to visualise the impact of variations to R-groups, fragments or linkers on the properties of compounds within a chemical series.
StarDrop’s visualisation capabilities include the ability to display various chart types within each cell of an SAR plot including:
- Heat maps
- Radar plots
- 2D scatter plots
- Pie Charts
You can represent additional properties by colour and size, and trellis charts to highlight relationships between compounds, properties, and data sets.
Exceptional performance and flexibility with no unexpected costs
High performance and flexibility
StarDrop brings all your key medicinal chemistry tools together—SAR analysis, ADMET prediction, docking, and more—in one intuitive, end-to-end platform. Plus, expand StarDrop’s capabilities with easy integration to third-party and in-house tools. No switching platforms. No delays.
No surprise costs or setup stress
Whether deployed on-premise or in the cloud, StarDrop is quick to get started with and easy to maintain – saving time, cost, and effort across your organisation.
First-class support guaranteed
That’s why when you purchase a StarDrop licence, you get access to our dedicated team of Application Scientists with a combined experience of 50+ years in medicinal chemistry, who guarantee a quick response to your query, and deliver free, interactive training sessions. StarDrop’s intuitive design plus our dedicated scientist support ensures your team achieves breakthrough results faster – and has helped us achieve a customer NPS rating of 85.

Level up your data visualisation
Simply complete the form now for a free personalised demo and see how your data can be visualised in StarDrop.
See what our customers are saying:
“We routinely use StarDrop to visualise complex multi-parameter datasets, which helps inform the next stage of medicinal chemistry design. The user-friendly interface makes data analysis and property prediction easily accessible to medicinal chemists. A great drug discovery tool!”
Andrew Stott, Director, Cerevance
“StarDrop is a very compelling package – multiple powerful tools combined into a single piece of software accessed via a very intuitive user interface. The ease with which powerful MPO scoring functions and QSAR models can be generated and applied to new ideas, as well as the ability to predict metabolic liabilities, make StarDrop the go-to software for ensuring project progression.”
Dr Robert Pace, Medicinal Chemist, Evotec
“StarDrop is a fantastic tool to have as a medicinal chemist, whether you do early-stage medicinal chemistry or deal with a huge amount of data. It’s super quick – I can have a view on my SAR within five minutes, to inform future design strategies.”
Sébastien Alazet, Medicinal Chemist, adMare Bioinnovations