Copy and paste from StarDrop
This short video illustrates how to you can simply copy selected compound identifiers, structures and any data directly from StarDrop…
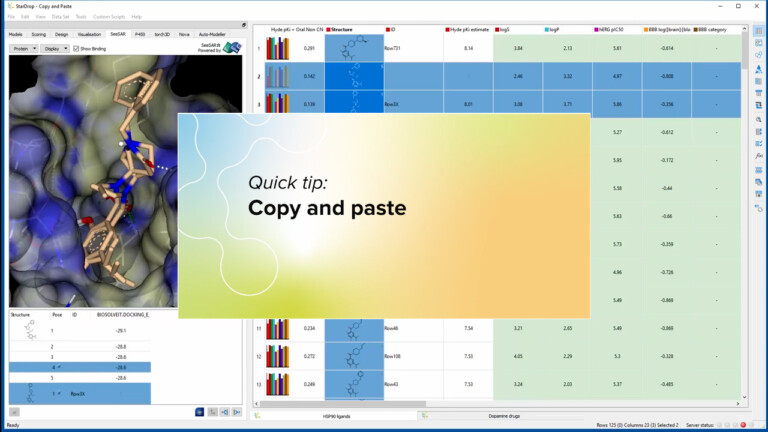
This short video illustrates how to you can simply copy selected compound identifiers, structures and any data directly from StarDrop…
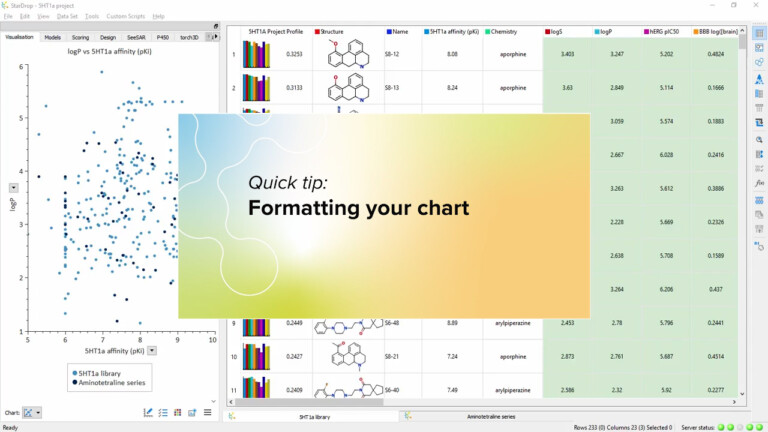
This video demonstrates how to format your charts, using the properties in your data set, by colour, size, symbol, transparency.
In this quick video, we show the many ways you can interact with your chart to show exactly the data…

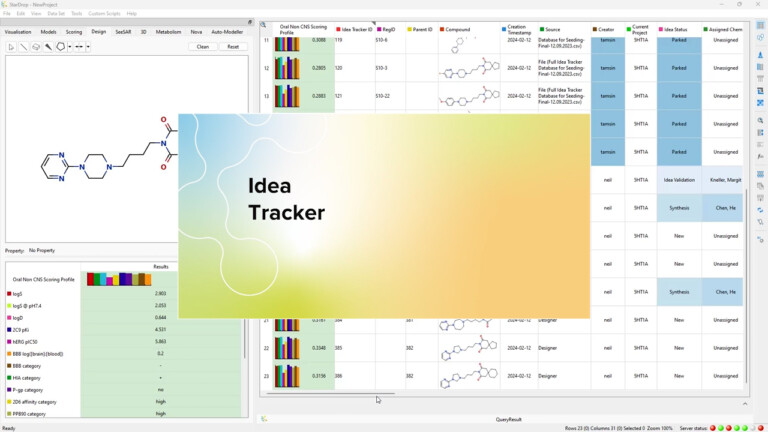
Want to accelerate your drug discovery with collaborative design and informed decision making? Watch our introduction to Idea Tracker, an…
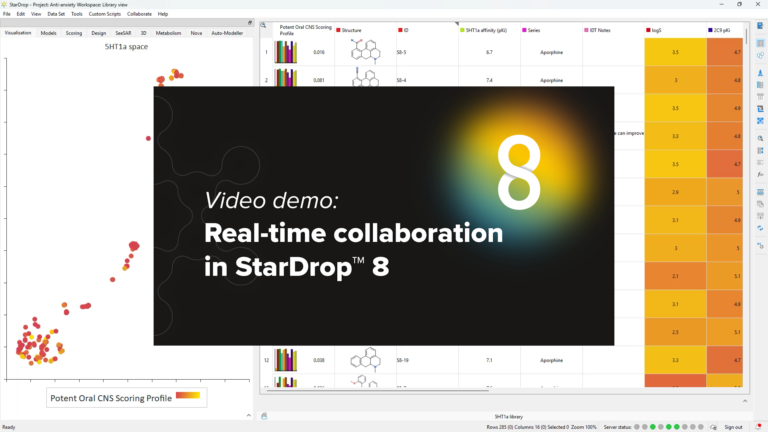
See how StarDrop integrates powerful real-time collaboration into every stage of the molecule design and optimisation workflow. This ensures your…