Clustering in Card View
This short video gives an introduction to the Clustering tool in StarDrop and how you can interact with the results…
Card View® is a ground-breaking and intuitive way to view compounds and their relationships in the context of your discovery projects. It breaks free from restrictive ‘chemical spreadsheets’ or traditional ‘form views’ that make it difficult to find optimal compounds and key structure-activity relationships.

Card View presents compound structures and associated data on cards that can be moved and organised with complete freedom. This enables you to explore your data in a flexible and interactive way and organise compounds in a way that mirrors your thought processes to quickly make good decisions. The resulting cards and views can be conveniently annotated and copied to clearly share your conclusions.
You can create cards of any dimensions and flexibly format your data in multiple columns, along with your own titles and labels through an easy to use, drag-and-drop card designer. Card designs can be easily saved and shared, making it easy to present your compound data in a consistent, information rich way.
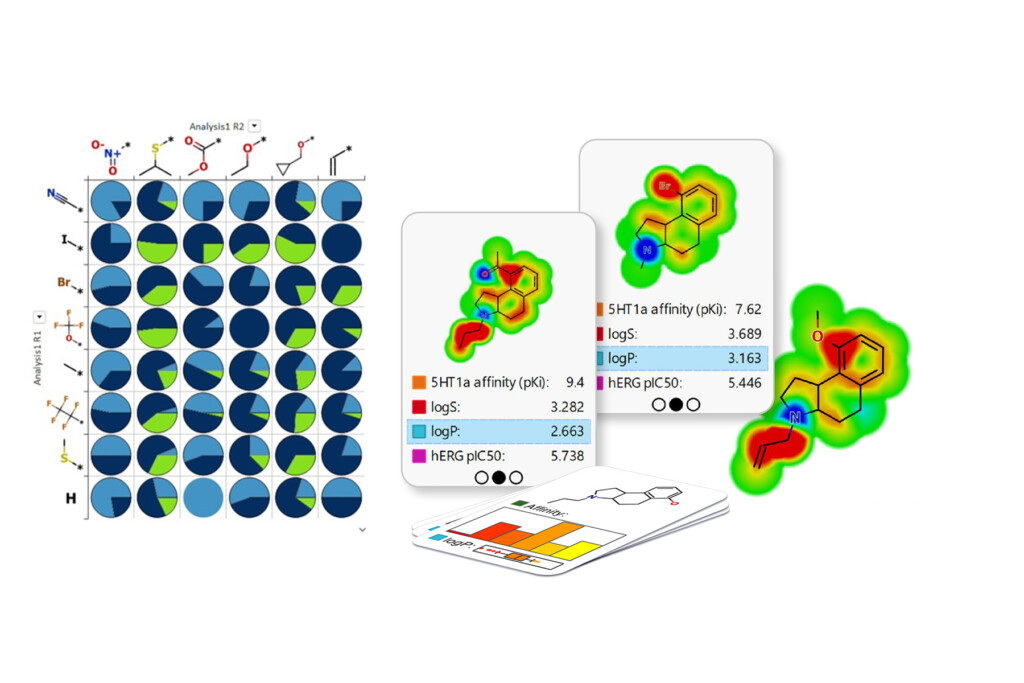
Analyses, such as clustering or matched pair analysis, can easily be applied to organise compounds and highlight interesting patterns or features that guide further optimisation strategies.
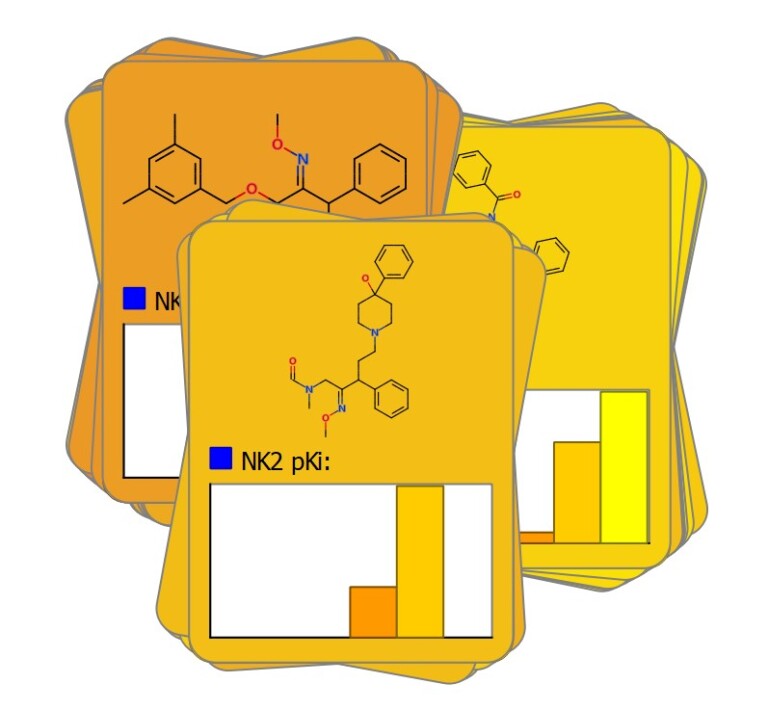
Each compound is represented by a card that may be moved with complete freedom. A card can show any combination of structure and/or property data that you choose and you can define multiple pages of information that enable you to drill down to see more detailed results. Different card designs can be applied instantly, so your colleagues can see the data that are most important to them. Colouring cards by key properties or comparing compounds side by side makes it easy to spot key differences and choose between alternatives.
You can group cards into stacks, simply by dropping one on top of another. Stacks make it easy to get an overview of key properties of groups of compounds; as with cards, you can choose what information you want to see and property distributions can be clearly displayed as histograms or box plots. Comparing stacks representing chemical series of compound clusters clearly identifies the high quality chemistries in your project.
Cards can be linked to represent relationships, such as synthetic steps, structural transformations or idea flow. You can instantly organise linked cards into hierarchies or networks to illustrate progression or the relationship between groups of compounds. By colouring these links, you can highlight critical steps that led to significant improvements in compound properties and find new strategies that can be applied to make further optimisations.
Computational methods such as clustering, matched molecular pair analysis and activity landscapes, analyse complex data and produce valuable information to guide compound optimisation. But, interpreting their outputs has been a challenge, requiring laborious, expert analysis. Now, Card View displays these results in a visually intuitive way, making it easy for everyone to interpret the results and quickly draw conclusions. In addition to the analyses above, which are already in StarDrop, you can also add your own methods and present the results as layouts in Card View.
This short video gives an introduction to the Clustering tool in StarDrop and how you can interact with the results…
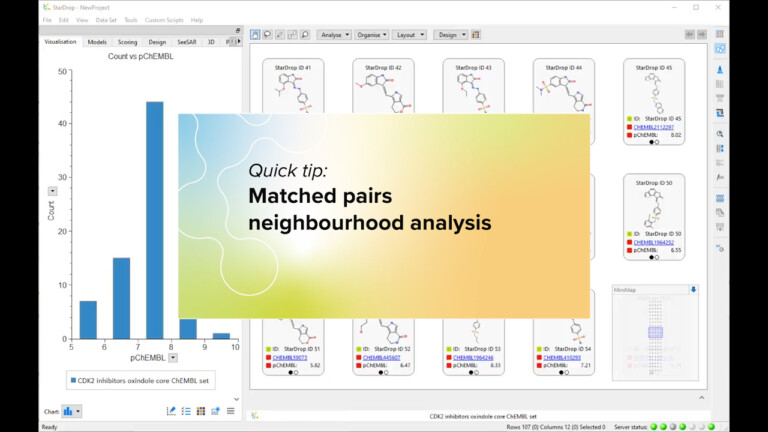
This short video gives an introduction to the Matched Pairs Neighbourhood tool in StarDrop’s Card View. If you are interested…
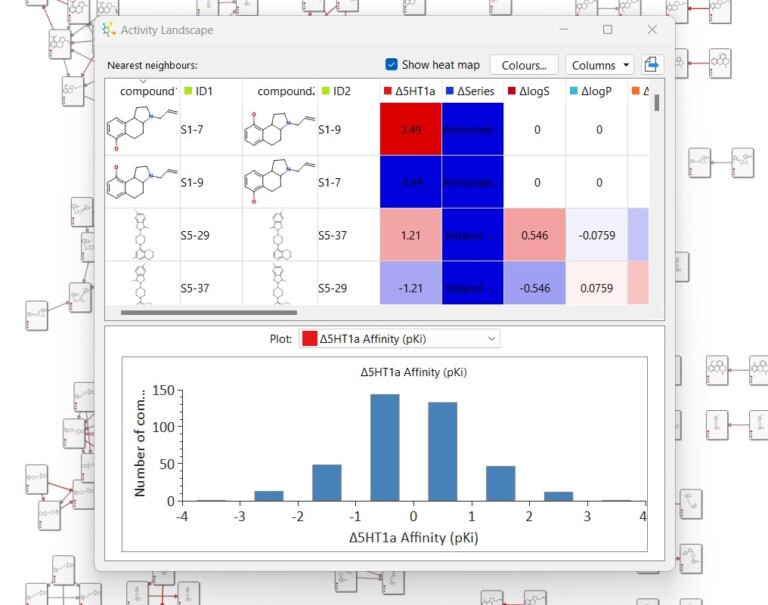
This short video gives an introduction to the Activity Landscape analysis tool in StarDrop and how you can view and…
To try Card View in StarDrop simply complete the form and the team will be happy to discuss your needs.
With its comprehensive suite of integrated software, StarDrop delivers best-in-class in silico technologies within a highly visual and user-friendly interface. StarDrop enables a seamless flow from the latest data through predictive modelling to decision-making regarding the next round of synthesis and research, improving the speed, efficiency, and productivity of the discovery process.